


Brian Gallagher has had a variety of engineering and management roles designing human machine interfaces (HMIs) in the biotech and automotive industries. Most recently, he is the cofounder of Andromeda Interfaces, which develops HMIs for many different industries.

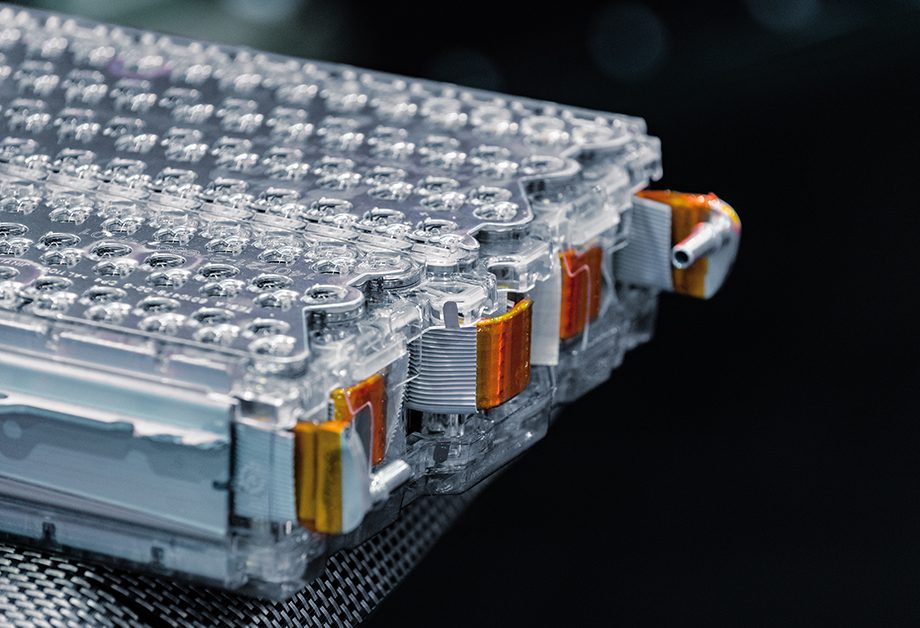
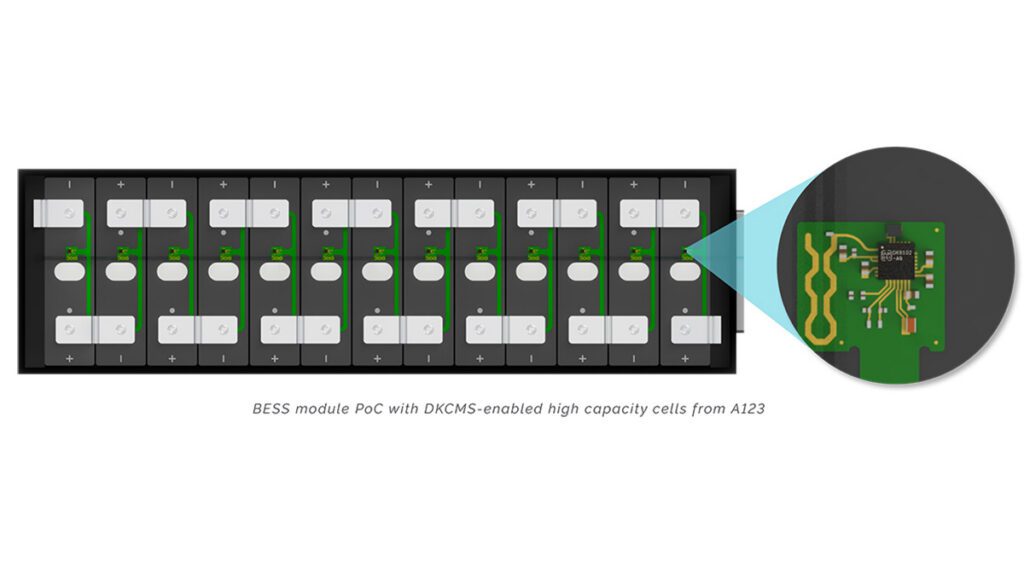
With the adoption of lithium-ion battery technology in electric vehicles, the role of battery management systems (BMS) has become vital – measuring and reporting critical real-time information about the operation of the battery pack. An EV’s pack is comprised of many individual cells working together in groups. The primary responsibility of the BMS is to maintain the same state of charge (SOC) among all the cells by performing energy management. It is essentially the “brain” of the pack, and data is continually being monitored, processed and stored to prevent damage to the cells.
The amount of cell data being provided by the BMS is comprehensive, and becomes quite a challenge to troubleshoot in the event that an issue arises. The question is: How can we successfully translate the data into a form that technicians and engineers can use to diagnose or test battery packs easily?
Critical BMS cell data
The single most important function of a BMS is cell protection. Lithium-ion cells possess characteristics that make it necessary to monitor them. If the cells are overcharged, they can be damaged and cause overheating. If the cells are discharged below a certain threshold (approximately < 5 percent of total capacity) the cell’s capacity can become permanently reduced.
 The second most important function performed by a BMS is energy management. In an ideal design, all the battery cells in a pack should be kept at the same SOC. When any of the cells go out of balance, individual cells can get stressed, leading to premature charge termination and contributing to a reduction in the overall capacity and cycle life of the battery pack.
Voltage, temperature and location data for each cell is needed to enable the BMS to successfully perform its job. Depending upon the battery pack’s energy and voltage design requirements, the total amount of data being monitored and maintained by the BMS from each of the cells can become overwhelming.
Battery packs are pushing higher and higher voltages to increase their efficiency and to deliver more power. Let’s assume we have a battery pack with a nominal voltage of 600 VDC with LiFePO4 cells (3.3 V nominal). We would need up to 182 cells to reach the battery pack’s operating voltage and, depending upon your energy requirements (kWh), that number could double or triple. If we consider monitoring each of the cell’s voltage and temperature measurements, there are potentially over 250 data points to monitor.
A traditional approach to displaying this amount of data points is to set up rows for each of the units monitoring the battery cells and then establish columns to populate each of their measurement readings. In visual programming-speak this is classically performed with Data Grid View controls, which is basically a spreadsheet.
This amount of data displayed on a screen doesn’t translate well for anyone who needs to quickly interpret the battery pack’s performance from each of the battery cells. It will take time to process all of this text on the screen.
Know your goals
Goals are not the same as tasks or activities. A goal is an expectation of an end condition, according to well-known software designer and programmer Alan Cooper, whereas both activities and tasks are intermediate steps that help someone to reach a goal or set of goals. Goals are driven by human motivations, so they can change slowly, whereas activities or tasks are much more transient since they are based on whatever technology is available. For example, taking a trip to the bank, a person’s goals are likely to include withdrawing or depositing money into their bank account. Nowadays, a person would take advantage of an ATM machine to fulfill those goals, but 100 years ago your only option was to go inside the bank and interact with a bank teller. In any era, the goal is the same, but the activities and tasks have changed completely, because of technology.
In the world of Interaction Design, which is the practice of designing interactive digital products, tools and services, there is a design process called Goal-Directed. In its simplest form, Goal-Directed implements a process to ensure that when designing digital products with human interaction, end users will be able to quickly achieve their desired results rather than becoming tangled in computer or machine minutiae.
Now that we’ve gone through a crash course on Goal-Directed design, let’s revisit our BMS application and apply this design approach.
The type of person who would care if the BMS is performing its duties is most likely a test engineer. Test engineers are responsible for resolving or identifying issues so they can continue testing and validating both the BMS and the battery pack’s design. They rely heavily on diagnostic tools to aid them in their efforts. So what would their goals be for utilizing these tools?
You may think that their goals would be to perform testing and validation more efficiently, but this is not necessarily true. Efficient testing and validation are the goals of the test engineer’s employer. Test engineers are more likely concentrated on their personal goals of being competent at their job and keeping themselves engaged with their work while performing routine and repetitive tasks.
Knowing our test engineer’s goals, and having a clear understanding of a BMS’s purpose, we can come up with a user interface to make the experience of viewing battery cell data more intuitive instead of processing a giant matrix of data in text.
Creatively displaying battery cell data
In an effort to find new and innovative ways to display cell data – and in collaboration with a colleague who is a BMS expert from a major Li-ion cell manufacturer – we developed a new graphical design approach dubbed “Flubber.”
At this point Flubber is only a concept; it doesn’t exist in any testing products. This discussion is intended to open up ideas and inspire other HMI designers to think differently about the wealth of information that comes from the BMS and consider other ways to help test engineers read a pack’s data more quicker.
Flubber appears as a histogram that has been smoothed out with a spline function. It represents the number of cells in a battery pack.
The Y-Axis plot shows the battery cells voltage range from 2.0 V to 4.0 V, and the X-Axis represents the cell’s SOC levels. The goal is to ensure that the battery cells stay close to each other while moving across the X-Axis. This would suggest that the cells are well-balanced throughout their usage (charging or discharging).
If the batteries are well-balanced and fully charged, then Flubber will be at a sharp peak to the right of the plot (Figure 1).

If they are completely discharged and balanced, then Flubber will be flat and furthest to the left (Figure 2).

If the cells are out of balance, then Flubber should look scattered throughout the plot (Figure 3) and we can then change the color to red to indicate that something is wrong.

If the majority of our battery cells are balanced and charged, but there are a few still out of balance, then our graphical representation would quickly point out our castaways (Figure 4).

Another feature we could implement is interaction with our battery cells to see specific measurements from each of them. This would be a similar concept to a company’s plot for stock prices over time. When viewing these types of plots on mobile devices, you can interact with them by touching any point on the plot to bring up a dialog box with their stock price at that given point. We could apply a similar concept to view our battery cell measurements on Flubber (Figure 5).

Among the vivid screenshots, the user should be able to quickly identify whether or not the battery cells are completely balanced and determine if they are fully charged or discharged. The overall objective is to satisfy a test engineer’s personal goals: utilizing intuitive software tools to effectively perform the job.
When considering how people interact with software tools, we should first remember that a tool addresses human needs by amplifying human capabilities. Creating tools that aid people in helping them achieve their goals will keep them satisfied, effective and delighted to keep using them. Before creating any tools for humans to interact with, you first have to understand the person’s goals and motivations for using them and then design them to fit the human body and its cognitive abilities.