


The experts at Mentor Graphics walk us through the simulation and analysis of a battery pack cooling system.
In the business of battery pack design, one of the main considerations is cooling. The pack must have a uniform and stable temperature for the batteries to perform adequately during worst-case conditions. Even within a single cell, high gradients can cause it to degrade faster and fail earlier.
With the advent of advanced computer simulations, engineers are now able to test the performance of many iterations of cooling designs before ever creating a physical prototype. These techniques, known as computational fluid dynamics (CFD) simulations, save an enormous amount of time and money when analyzing and enhancing different designs. And the capabilities of simulations continue to evolve and advance.
In the past, CFD analysis was typically assigned to a highly trained specialist. However, a new generation of CFD tools now runs natively from the same CAD software that engineers use to design the mechanical structures of the system. That means there is no need to create a separate CFD model, and any redesigns can be done immediately.
A strong linkage between typical CAD software and CFD capabilities is especially powerful at a design stage where a lot of changes are still necessary. It allows for a faster iterative approach to the overall thermal design and provides a good characterization of the cells.
A 1D CFD tool, like Mentor Graphics Flowmaster, is good for analyzing the overall performance of a system and for identifying how the components interact, while a 3D CFD program, like Mentor Graphics FloEFD, allows designers and engineers to analyze flow paths, the pressure drop, velocity, heat transfer and local temperatures (Figure 1) – without the need to call in a CFD guru.
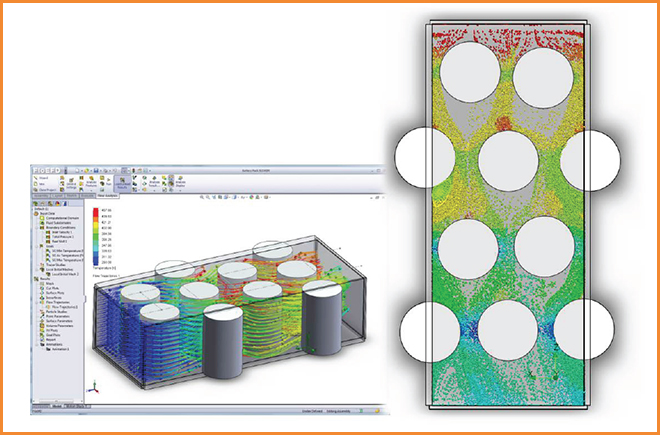
Figure 1: Battery pack modeled with 3D CFD
Charged recently talked to the experts at Mentor Graphics to better understand the process of 1D and 3D CFD simulation techniques. According to the company, combining both approaches will maximize design efficiency.
1D: The system level
One of the biggest benefits of 1D CFD is how quickly a system analysis can be completed, especially for transient analysis. Transient analysis is a time-dependent simulation, for example, a simulation over a time period when something heats up or cools down, as in a real-life situation. A system-level approach using 3D CFD is more difficult and takes much longer.
One very important consideration is how to represent the battery pack. It would be easy, and can be acceptable in some cases, to model it as a single lumped component, using an overall heat transfer coefficient and combined thermal duty. However, when accuracy is very important, the pack is modeled as individual cells, to ensure that any temperature gradients across the pack are captured (Figure 1). Also, because the pressure loss and heat transfer associated with the piping in the system is considered negligible, these parts of the system are excluded from the model.
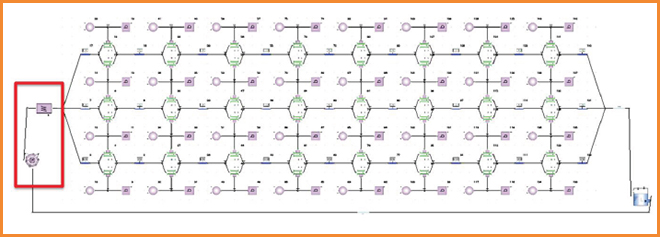
Figure 2: Battery pack modeled with 1D CFD
1D CFD requires significant amounts of data to describe the physical phenomena going on inside each component. But the need to find performance data is minimized, because products like Flowmaster have substantial built-in databases of empirical data for a wide range of geometric components such as valves, bends and junctions.
3D: The component level
For analysis at the component level, 3D CFD allows the study of very detailed flow and thermal behavior. A 3D CFD program can analyze flow paths through the pack, as well as the pressure drop, velocity, heat transfer and local temperatures to evaluate performance. Any unacceptable operations, such as misguided flow patterns or extreme thermal gradients, can be identified early.
Later in the design process, when the performance of the entire cooling system is the main concern, 3D CFD helps to create a more accurate 1D system simulation. Precise characterization data for the components in the 1D model is obtained from 3D CFD, instead of from the generic built-in databases.
How-to: Peak condition cooling
Let’s say we want to find an appropriate volumetric flow rate to keep a given system under the 40 degrees C critical temperature for Li-ion batteries. The 30-40 degrees C temperature band is a general guideline that the industry has been following to preserve the lifespan of the costly batteries. We’ll use a worst-case scenario to make sure the system is able to meet the heat rejection requirements without the use of the cabin air-conditioning circuit that some manufacturers are using in very high-demand cooling applications.
First, a parametric study is done using the 3D FloEFD simulation software to determine the minimum pump volumetric flow rate required to keep the pack under 40 degrees C, using a 50/50 glycol/water coolant and 20 degrees C ambient temperature. The heat rejection of each cell is set at 30 W, and the pump flow rate is varied from 2 to 15 L/min.
As shown in Figure 3, the minimum flow rate that ensures all sections of the battery pack are maintained below 40 degrees C is approximately 9.5 L/min. A simple crosscheck with the pump supplier can ensure that the pump selected for the system meets this requirement.
How-to: Pump performance versus battery load
Now that the minimum volumetric flow rate has been determined, we’ll want to understand how the cooling pack will perform under a range of operating conditions, particularly when changing coolant flow rates and cell load. Again, run a parametric study of the cooling pack in FloEFD, and then, from those results, create a surface map of cooling pack temperature versus coolant flow rate and cell load (Figure 3 shows an example). This map provides a quick reference for the ideal conditions to which the cooling pack should be exposed and gives an opportunity for redesign if it is deemed unacceptable.
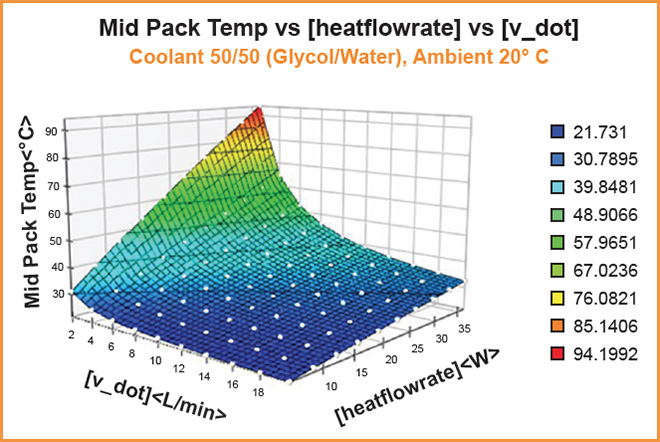
Figure 3: Surface map of cooling pack temperature versus coolant flow rate and cell load from the parametric study of the cooling pack
From the surface map, you can produce a trend line that shows battery cell load versus pump performance (an example is shown in Figure 4). You can now use this data as a starting point for tuning the pump control algorithms. For example, an intended battery cell load of 20 W shows a required coolant flow rate of 5.5 L/min to stay below the critical temperature of 40 degrees C.

Figure 4: A trend line shown in the battery cell load vs. pump performance diagram for temperatures just around 40° C
In addition to creating a pump control algorithm, you can use the surface map to characterize the cooling pack’s thermal performance. Along with the pressure-drop data, this information is all that is required to model the cooling pack in Flowmaster.
How-to: Best “warm-up from cold start” configuration
After the initial component-level design has been deemed acceptable with 3D CFD analysis, it is important to investigate how it will perform within a system using a 1D CFD like Flowmaster. A critical real-life challenge for EV battery systems is warming up from a cold start, because there is no internal combustion engine to provide heat. Imagine it is a cold winter day in Chicago at -10 degrees C, and the vehicle battery pack needs to reach an acceptable operating temperature (AOT) within a reasonable time. With no internal combustion engine, a source of heat for cold startup, such as a positive temperature coefficient (PTC) heater, needs to be installed.
Two quantities can be varied in this simulation: pump speed and PTC heater size, as well as the acceptance criteria for the cooling pack to reach 20 degrees C in less than 30 minutes.
In this example, we’ll analyze high and low pump speed with a range of heater power from 2 kW to 10 kW.
The simulation shows that, apparently, the pump speed doesn’t have much influence on the total warm-up time, and running it at half speed will take a lot of load off the auxiliary battery without affecting warm-up time.
That means you can simplify the design parameters to just varying the size of the heater. As shown in Figure 5, the smallest PTC heater that would work for the system is 3 kW to reach an AOT of 20 degrees C in less than 30 minutes.
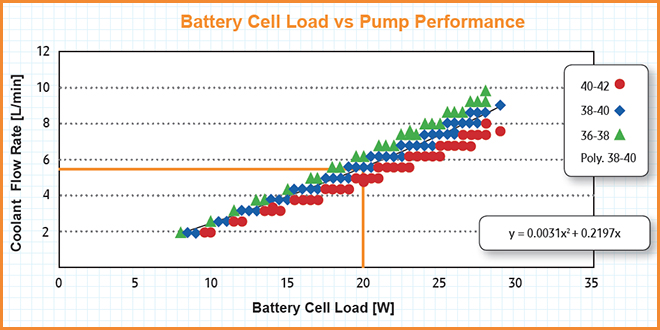
Figure 5: In this example, a 3-kW heater is needed to reach an acceptable operating temperature of 20° C in less than 30 minutes
Another interesting point is the difference between front and rear cells in the warm-up study. A snapshot shows a difference of 5 degrees C between the front and rear of the pack. If that was unacceptable for the design objectives, you could re-run the analysis with a higher flow rate, add an extra heater for the rear cells, or reconfigure the flow geometries to create better flow around the pack.
Design efficiently
The engineering processes used to create efficient and effective cooling systems are just as important as the physical components themselves. Choosing the best tools is critical, and using the right CFD simulation techniques during design will maximize the process and the final system’s efficiency.
Mentor Graphics’ team of experts that contributed to this article includes: Steve Streater, Industry Product Manager for Flowmaster Automotive; Boris Marovic, Industry Manager for Automotive and Transportation; Doug Kolak, Industry Product Manager; and Michael Behling, a former Application Engineer with Flowmaster.
This article originally appeared in Charged Issue 15 – August/September 2014
![]()