


If you can’t measure it, you can’t manage it, as the saying goes. The degree of progress towards full adoption of EVs seems like something that wouldn’t be easy to measure, but if anyone can do it, it’s probably data analytics powerhouse J.D. Power.
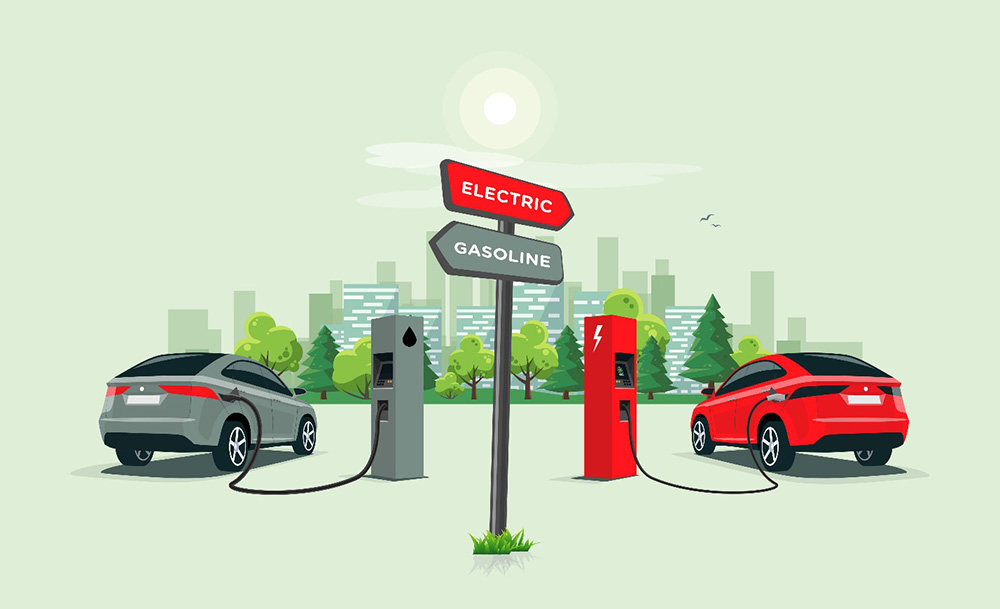
The J.D. Power EV Index is a new analytics tool designed to track the growth of the EV market in the US. Each month, the index arrives at a single number (on a 100-point scale) that represents the progress towards parity of EVs with legacy ICE vehicles. Sub-category numbers represent various roadblocks to parity.
Metrics are available at the national, regional, state and Designated Market Area (DMA) levels, and can be broken down by segment, brand and model.
The latest EV Index score is 47 (as of November 2022). Some categories improved and others declined during the 12-month pilot period.
J.D. Power aggregates millions of data points into six specific categories to make up the EV Index:
- Interest—Potential commitment to purchasing an EV based on customer data. The Interest score is currently 32, up 8 points from a year ago in the pilot phase, due largely to the growing number of EV models available or soon coming to market.
- Availability—The proportion of new-vehicle buyers who have an EV purchase option that meets their buying needs. The Availability score is 30, up 12 points year over year.
- Adoption—The proportion of new-vehicle buyers who purchase an EV. The Adoption score is 22, down 4 points from a year ago.
- Affordability—The total cost of ownership of an EV compared with the ICE segment average (considering incentives, operating costs and residual value). The Affordability score is 84, down 12 points year over year, as EV prices have increased and 15 models lost eligibility for tax credits beginning in August when the IRA’s North America manufacturing criteria kicked in. The Affordability score is expected to change dramatically for January as the manufacturers’ volume cap is lifted.
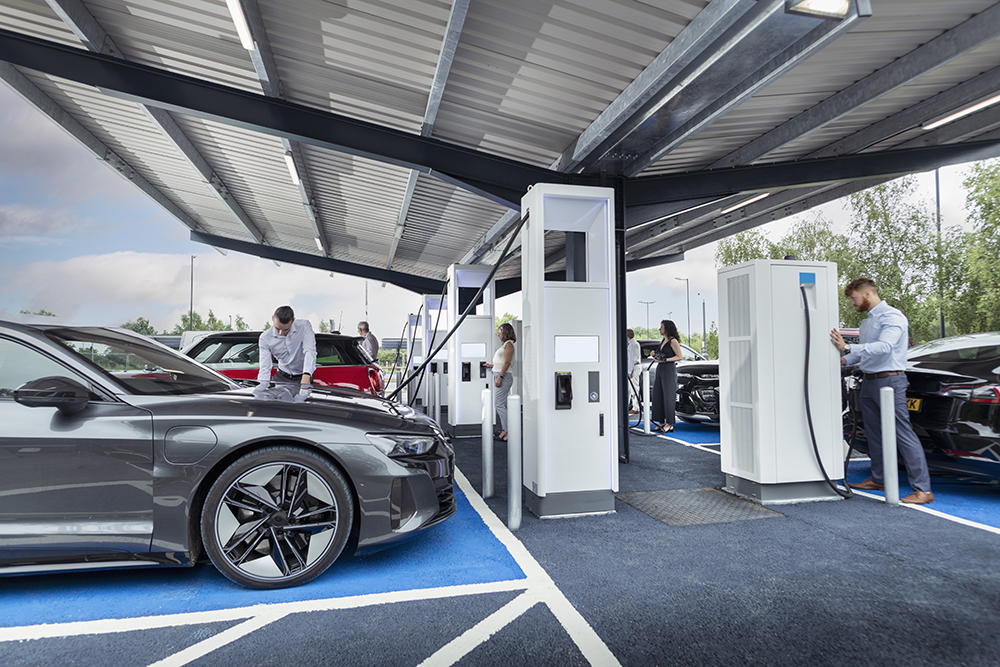
- Infrastructure—Availability, location, speed and reliability of EV charging. The Infrastructure score is 27, down 4 points, primarily because the volume of EVs in operation is outpacing the rate of charger installations.
- Experience—Owners’ overall satisfaction with their EVs, including appeal, quality, durability, range and the sales and service experiences. The Experience score is 89, down 2 points from a year ago.
“Vehicle electrification has industry leaders grappling with billion-dollar decisions, and hyper-detailed data and analytics will help guide their decision-making,” said Elizabeth Krear, VP of Electric Vehicle Practice at J.D. Power. “We’ve created a smart and dynamic way to capture how the EV marketplace is performing in relation to gas-powered vehicles, and the index provides a heightened level of detail never seen before in this arena.”
Source: J.D. Power