


Matt Stevens is the CEO of FleetCarma. The company created an EV monitoring solution and has compiled a large database of real-world EV performance.
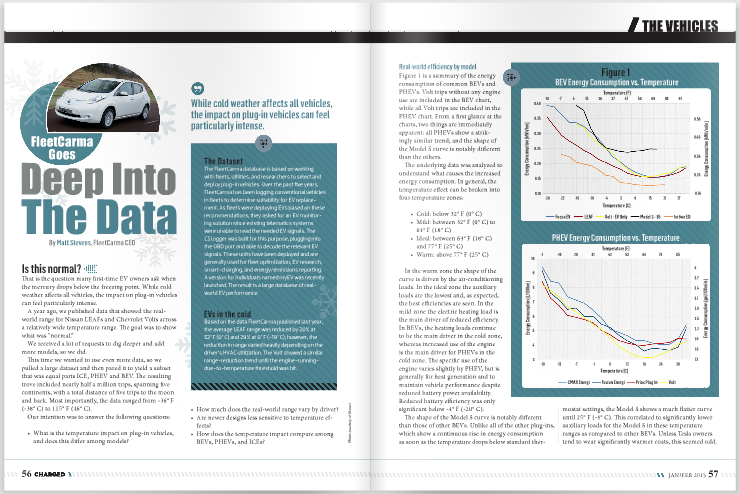
Is this normal?
That is the question many first-time EV owners ask when the mercury drops below the freezing point. While cold weather affects all vehicles, the impact on plug-in vehicles can feel particularly intense.
A year ago, we published data that showed the real-world range for Nissan LEAFs and Chevrolet Volts across a relatively wide temperature range. The goal was to show what was “normal.”

We received a lot of requests to dig deeper and add more models, so we did.
This time we wanted to use even more data, so we pulled a large dataset and then pared it to yield a subset that was equal parts ICE, PHEV and BEV. The resulting trove included nearly half a million trips, spanning five continents, with a total distance of five trips to the moon and back. Most importantly, the data ranged from -36° F (-38° C) to 115° F (46° C).
Our intention was to answer the following questions:
- What is the temperature impact on plug-in vehicles, and does this differ among models?
- How much does the real-world range vary by driver?
- Are newer designs less sensitive to temperature effects?
- How does the temperature impact compare among BEVs, PHEVs, and ICEs?
Real-world efficiency by model
Figure 1 is a summary of the energy consumption of common BEVs and PHEVs. Volt trips without any engine use are included in the BEV chart, while all Volt trips are included in the PHEV chart. From a first glance at the charts, two things are immediately apparent: all PHEVs show a strikingly similar trend; and the shape of the Model S curve is notably different than the others.

The underlying data was analyzed to understand what causes the increased energy consumption. In general, the temperature effect can be broken into four temperature zones:
- Cold: below 32° F (0° C)
- Mild: between 32° F (0° C) to 64° F (18° C)
- Ideal: between 64° F (18° C) and 77° F (25° C)
- Warm: above 77° F (25° C)
In the warm zone the shape of the curve is driven by the air-conditioning loads. In the ideal zone the auxiliary loads are the lowest and, as expected, the best efficiencies are seen. In the mild zone the electric heating load is the main driver of reduced efficiency. In BEVs, the heating loads continue to be the main driver in the cold zone, whereas increased use of the engine is the main driver for PHEVs in the cold zone. The specific use of the engine varies slightly by PHEV, but is generally for heat generation and to maintain vehicle performance despite reduced battery power availability. Reduced battery efficiency was only significant below -4° F (-20° C).
The shape of the Model S curve is notably different than those of other BEVs. Unlike all of the other plug-ins, which show a continuous rise in energy consumption as soon as the temperature drops below standard thermostat settings, the Model S shows a much flatter curve until 25° F (-4° C). This correlated to significantly lower auxiliary loads for the Model S in these temperature ranges as compared to other BEVs. Unless Tesla owners tend to wear significantly warmer coats, this seemed odd. Analyzing the data between trips uncovered a notable difference between the Tesla and other plug-ins.
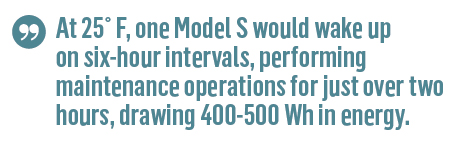
Nearly all of the plug-ins that are logged in the FleetCarma system wake up between trips and perform some battery management in cold weather, whereas Model S wake-ups are more frequent, last longer and draw more energy, as shown in Figure 2. At 25° F, one Model S would wake up at six-hour intervals, performing maintenance operations for just over two hours, drawing 400-500 Wh in energy. The result is a more conditioned battery.
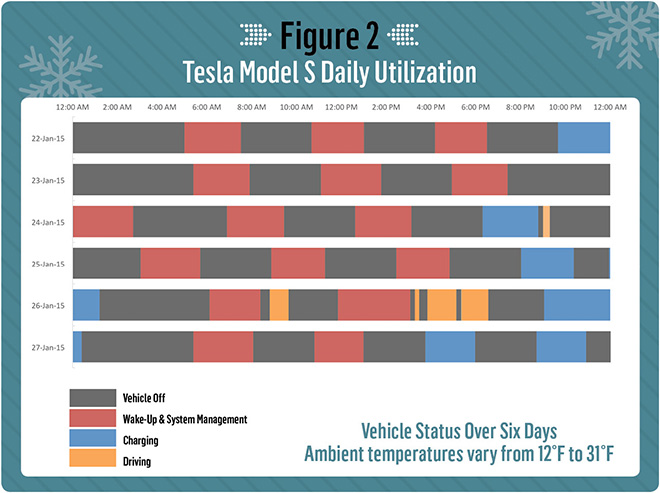
While the wake-up procedure is common, the increased usage of this process in the Model S shifts more energy consumption from during the trip to between trips.
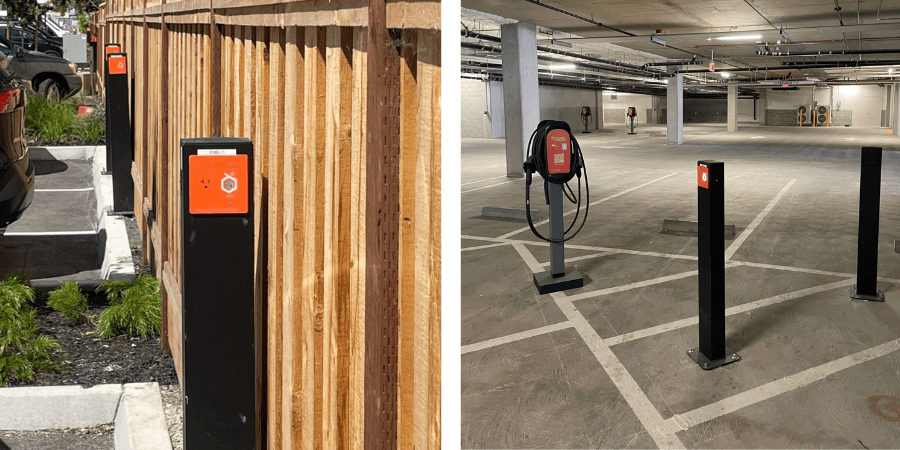
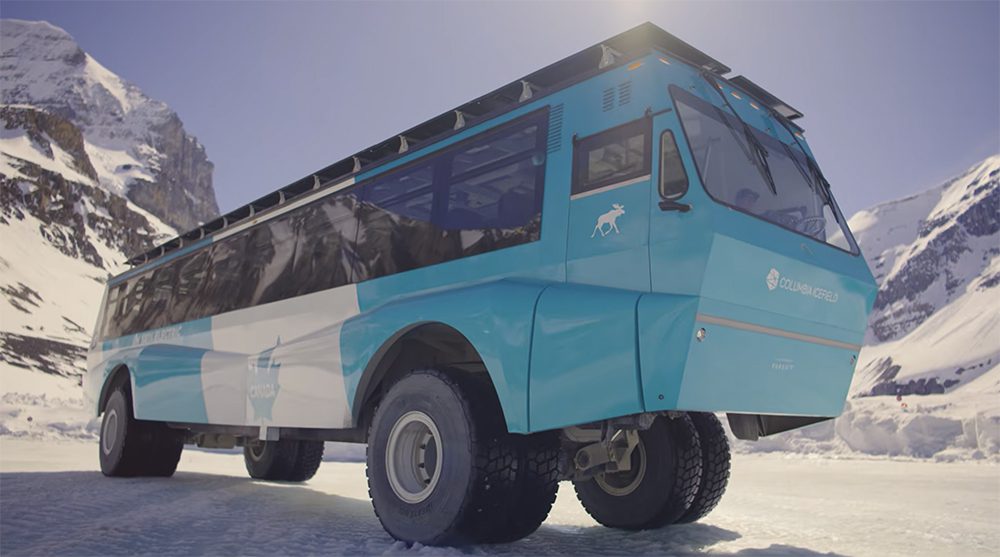
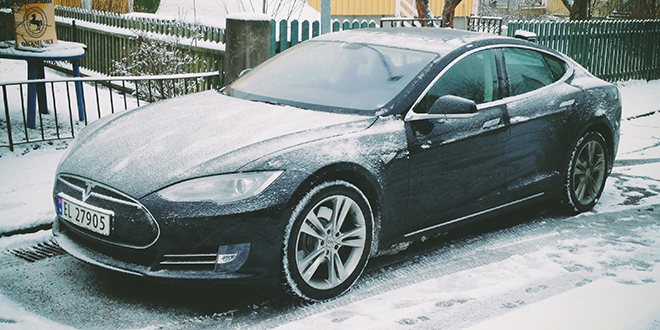 Photo by Robert Nordqvist ©
At a given temperature, how much does range vary by drivers?
The dataset we sampled included a large amount of LEAF data over a wide temperature range. The variance in real-world range is shown in Figure 3. The blue band represents 50% of all trips. For instance, at 75° F (24° C) half of the trips logged for that temperature had a range between 76 and 100 miles. The white line in the blue zones shows an average range of 87 miles and the orange line shows that the top 10% of trips had 116 miles or more of range. While the blue band narrows slightly as temperature decreases, it remains significant at all temperatures.
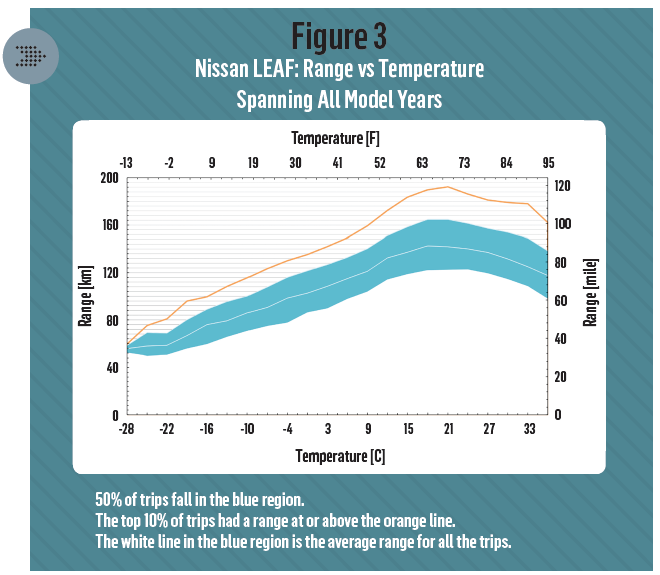
In the ideal temperature zone the variability is driven almost exclusively by drive cycle. Outside of the ideal temperature zone the variability is a combination of drive cycle, HVAC utilization, and vehicle pre-conditioning.
Both the LEAF and the Model S results underscore the significant impact that pre-conditioning can have on real-world range. Scheduling charging to finish just prior to departure or pre-conditioning the vehicle appears to add 10-15% more range.
Are new designs improving cold-weather performance?
The dataset was mined to extract any cases in which a new design could be compared to an earlier design. The best example of this was the Nissan LEAF. The 2013 model year of the LEAF included a number of refinements to the vehicle, including an updated HVAC system using a heat pump.
[Editors note: The 2013 LEAF used the same 24 kWh battery pack as the previous model, and was introduced with an EPA-estimated 75 mile range, only a slight increase from the 2012 model’s at 73 miles. However, Nissan later said that when using an updated EPA testing procedure the 2013 model’s range would be rated as high as 84 miles, an 11-mile improvement over the previous year’s model.]
We divided the LEAF range data into the two designs and charted the results in Figure 4. The data revealed that the newer design shows improved range at nearly all temperatures. On average, the new design nets an additional 8 miles (12 km) of range.

This bump in range due to a mid-model update underscores the speed of development on plug-in technology and bodes well for the performance of the new Volt design and upcoming LEAF redesign.
Are plug-in vehicles impacted more by cold weather than conventional vehicles?
Figure 5 contains two charts showing the impact of cold weather both on a percentage and a cost basis.
Based on a percentage of increased energy consumption, the upper curve shows that the plug-in vehicles have dramatically higher fluctuations compared to conventional vehicles.
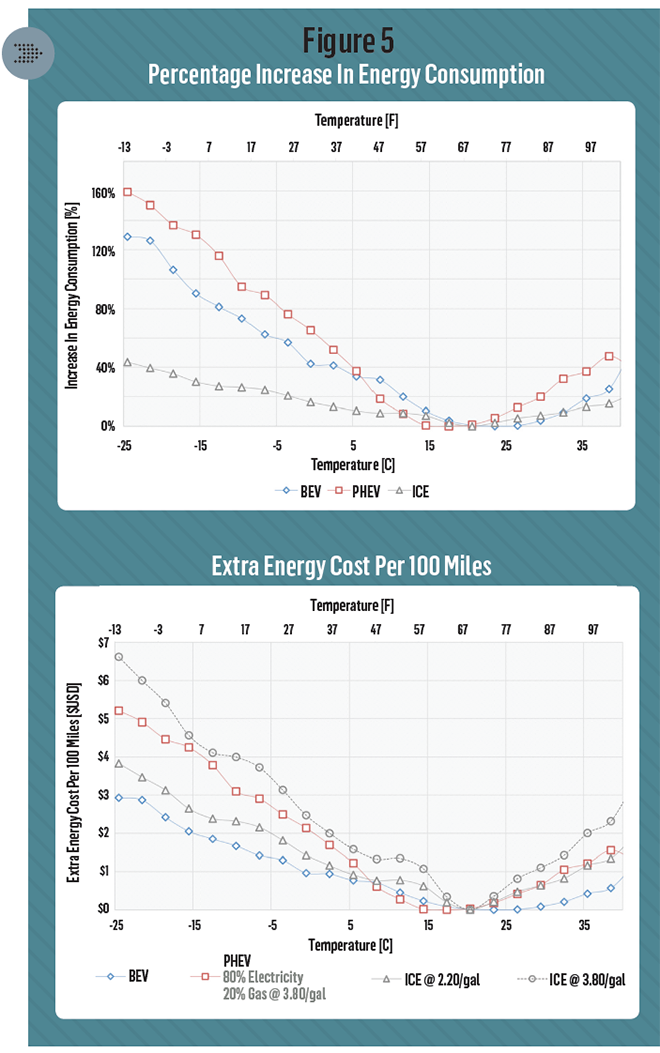
However, it may be more useful to understand the impact of cold weather on the owner’s wallet. The lower curve shows the extra energy cost per 100 miles assuming gasoline costs of $3.80 per gallon (about the average price of gas in Canada in early 2015, where FleetCarma is headquartered), $2.20 per gallon (about the average price gas in the US in early 2015), and $0.10 per kWh for electricity.
At $3.80 per gallon, weather clearly affects the cost of operating an ICE vehicle the most. At $3.00 per gallon, the PHEV and ICE curves essentially fall along the same line. And at $2.20 per gallon, the effects of weather on operating costs of ICE vehicles approached that of BEVs.
Looking at these two curves it becomes clear that, although cold weather has a larger impact on plug-in vehicles on a percentage basis, the financial impact of temperature is typically more significant for conventional vehicles. In most cases, the payback for electric vehicles actually improves as the weather gets colder.
Worldwide oil prices are currently at the lowest point in five years, which shifts these numbers slightly. However, the volatile and unpredictable nature of gasoline costs compared to electricity bodes well for EVs particularly with number-crunching fleet operators, because electricity is consistently cheap.
The bottom line: Is the impact of cold weather on your vehicle normal? It probably is. If you want more range, you have three options: use pre-conditioning, use heated seats instead of the cabin heater, or wait until April. Happy driving!